Financial Models: The Good, the Bad, and the Ugly
I’ve seen and designed hundreds of financial models over the years. Let’s talk a little bit about what characterizes a good model and some of the mistakes that can make a model bad or even ugly.
First, what is a financial model? Ideally, it is a tool that enables you to think in terms of your own business to translate your thoughts into forecasted financial statements, formatted in a fashion familiar to investors:
- It should be easy and intuitive to use.
- It should facilitate what-if analyses so you can see the ramifications of different assumptions on future performance.
- It should be self-documenting so you and your prospective investors can easily see the assumptions that produce a set of forecasted financial statements.
- It should produce attractive tables and charts that are easily inserted into your business plan.
- It should be robust, i.e., bug-free.
How do we design this ideal model? Let’s address the points I mentioned above:
- Translating thoughts into financial statements: This entails designing the model to reflect your business model. Franchise operations, SaaS products, manufacturers, service providers, and the wealth of other business models all involve different key assumptions and processes. Their business models are very different. The financial model should fit the user, versus making the user try to fit their business model into an inflexible model. That inhibits creative thinking. You want the model to facilitate creative thinking by making the model invisible. You shouldn’t have to spend time fighting the tool or even thinking about the tool. You should be able to think about your business, with the model supporting the creative process.
- Easy and Intuitive to use: Again, this involves designing the financial model to fit your business model. But more than that, the assumptions should be organized so you can instantly see what they drive. The number of assumptions should be minimized, with key assumptions driving multiple events.
Contents
A Franchise Example
Let’s use a concrete example, say, a franchise operation. We’ve developed a unique process for cleaning trucks, one that involves specialized equipment that we plan to manufacture, along with proprietary processes and procedures for operating a cleaning facility. Our franchisees will pay us for the equipment up front, and then a percentage of their revenues. We anticipate franchising into locations that will realize significantly different sales volumes. Smaller towns are underserved by the competition, so we anticipate more franchisees in these smaller locations. Sales will ramp up more slowly in smaller towns, and then average monthly sales will be less than those in larger towns. Larger facilities will require more equipment to support their higher sales volumes. We want to play what-if with respect to all these key assumptions.
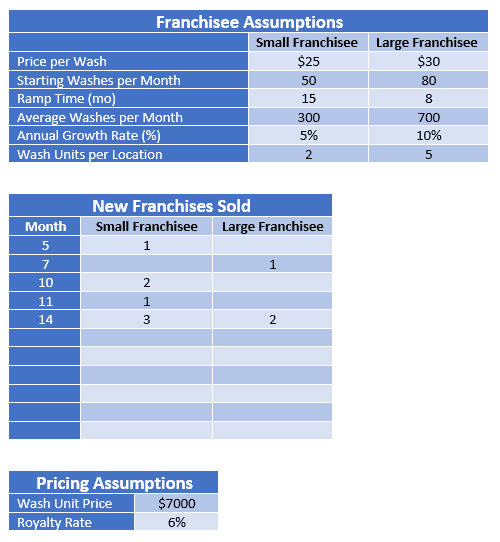
How do we organize these assumptions? What events do each assumption drive? Here is a possible organization:
With just these three tables, we specify all the assumptions necessary to drive revenues. The first table characterizes the behavior of large and small franchisees. The second table specifies the estimated dates that new franchises are sold. The third specifies the price franchisees pay for wash units and the royalty rates they pay on their revenues.
When a small franchise is sold in month 5, the franchisee pays us $14,000 for 2 wash units and sells 50 washes for revenues of $1,250. The model recognizes revenues of $14,000 for the equipment and $75 in royalties in month 5 and posts them to the income statement. Sales increase over the next 15 months to 300 washes per month in month 20 and then increase at a rate of 5% per year thereafter.
A similar set of events occur in month 7 for a large franchise, and so on for every line in the New Franchises Sold table. All these revenue streams are summed and posted to the income statement.
The three tables document all these assumptions that produce the associated set of pro forma financial statements. The tables are attractively formatted so they can be pasted into the Financial Discussion section of the business plan.
Financial Model Assumptions
Integrating all these assumptions so that changing any of them recalculates revenues is a nontrivial task. I typically set up an Assumptions tab containing the revenue tables and all the other assumptions regarding expenses and manpower loading. The Assumptions data goes into a Calculate tab that performs all the tasks necessary to calculate revenues, which are then posted to a Statements tab incorporating the Income Statements, Balance Sheets, Cash Flow Statements, capital expenditure and depreciation schedules, and other associated accounting information constituting the pro forma financial forecast.
These are what I consider good practices in financial model design. Bad practices would include such things as:
- including pricing assumptions in the franchisee assumptions, creating redundant data entry,
- separating functionality, such as requiring the user to separately enter receipts from equipment and royalties, requiring him to synchronize them manually, and
- entering dollar amounts rather than estimated washes per month, which is far less intuitive and destroys the ability to play what-if with pricing.
The most egregious ugly practice is burying assumptions within calculation cells, making it hugely difficult to document assumptions and dramatically increasing the likelihood of calculation errors.
I’ve focused on the revenue assumptions and associated user interface in this post. The revenue assumptions are the most important and most challenging to design. Also, investors question them more than any other assumptions.
The Thought Process
What you should do is give careful thought to your business model, define the critical assumptions, classify them, organize them, and figure out the actions that they should control. Separate functionality:
- data entry for assumptions,
- calculations performed to transform them into numbers you’ll post to the financial statements, and
- the actual statements themselves. You should not be performing calculations any more complex than simple sums on the statements page.
I start by designing the user interface. Figure out what assumptions you need to address and group them logically into tables in your spreadsheet. Getting them in front of you will help suggest assumptions you’ve forgotten to include, and whether the ones you’ve put down are necessary.
Next, figure out how you want your financial statements to look. For example, I often include a section at the top of the financial statements summarizing the information that drives revenues, such as unit sales. If you want to see unit sales, your calculation section can’t just generate dollar amounts for the income statement. You will need an interim calculation line showing units, which subsequent calculation lines can transform into dollar amounts. If you want to see separate lines for each product on the income statement, you will need to calculate those separately, and then sum them into total revenues.
Once you have a good grasp on the front-end assumptions and back-end results, you can start to figure out how to specify the formulas that get you from the frontend to the backend.
To do that, I often use old fashioned pencil and paper to develop the equations that will ultimately turn into Excel formulas. I also iterate from simple, generalized equations to more Excel-specific syntax. That is, I first get the relationships straight in my mind by writing them down, and then flesh them out into Excel formulas. To use a simple example:
Royalty Revenue = Unit Sales x Price x Royalty Rate
Unit Sales will change over time. So, we need to calculate the units sold in a particular month. Let’s assume that a franchise sells at full volume as soon as it opens. The general equation will be:
Royalty Revenue = If (month < Start Month, Then 0, Else Unit Sales x Price x Royalty Rate)
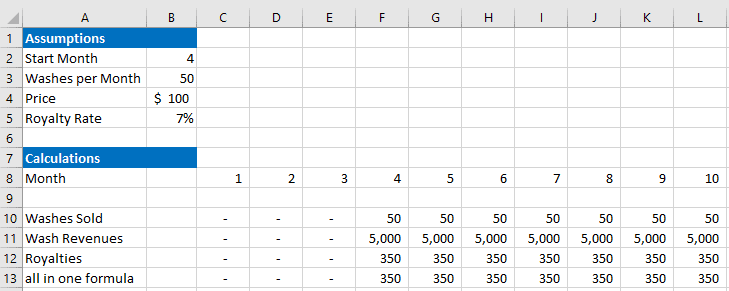
On your Calculate tab, create a month row numbered 1-60 for a five-year forecast. On the row used to calculate washes sold, we will compare the actual month in the month row with the Start Month specified on the Assumptions tab. Let’s say month 1 starts in cell C8, with month 2 in D8, etc. Washes sold are on line 10, wash revenues on line 11, and royalties on line 12, as shown below:
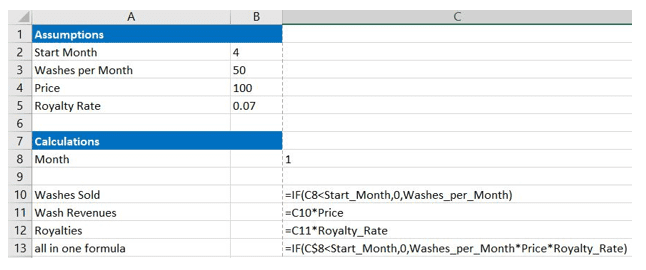
The separate lines for the number of washes sold, wash revenues, and royalties enable us to show washes and/or wash revenue as revenue drivers at the top of the financial statements. If you don’t want to show revenue drivers, you can integrate all the calculations into a single cell as shown on the all-in-one line. The illustration below shows the formulas used to calculate this information:
Note that I’ve named my variables instead of using cell references. This makes it vastly easier to read, understand, and debug your formulas. Just right click on the cell, select Define Name, and name the cell. Excel will suggest the text to the left, making it quick and easy to name your assumptions.
Robustness of the Model
It is quite difficult to design a complex spreadsheet without bugs. Therefore, you need to include error checking. A good method is ensuring that the balance sheet and cash flow statement cash balances are always the same. Even better, add a cash receipts and disbursements statement to the pro formas and make sure all three statements are in synch.
One of the ugliest practices is using the cash balance as a variable that you adjust to make statements agree. Don’t ever do that.
Let’s Summarize
- Get your assumptions onto an Assumptions tab in your financial model. Organize them logically for your business.
- Figure out what you want to see in the financial statements.
- Once you’ve figured out what you want to see in the financial statements, go back to the Assumptions tab and update the variables and their organization to better conform to the desired output.
- Create the code in a Calculate tab to bridge the assumptions to the desired output.
- Link the financial statements to the calculations.
For more useful tips and tricks for developing a sound financial model, see things-you-need-know-about-financial-forecasting.
For an example of the kind of financial models you can expect from Cayenne Consulting, see https://www.caycon.com/financial-forecast-services.
Finally, you will find an excellent introduction to financial modeling at https://corporatefinanceinstitute.com/resources/financial-modeling/free-financial-modeling-guide/.
If you have any questions, please leave a comment below!


